Note
Go to the end to download the full example code
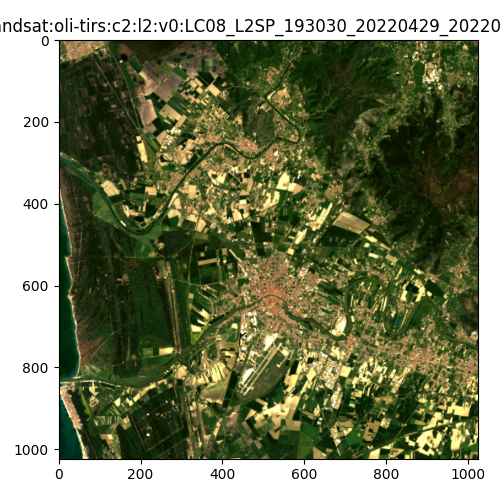
Simple Image Visualization
Visualize a true color Landsat 8 image.
from earthdaily.earthone.catalog import Product, properties as p
from earthdaily.earthone.geo import DLTile
from earthdaily.earthone.utils import display
Create a tile around Pisa, Italy.
tile = DLTile.from_latlon(43.7230, 10.3966, resolution=20.0, tilesize=1024, pad=0)
Use the Catalog API to search for imagery available over the area of interest.
search = (
    Product.get("usgs:landsat:oli-tirs:c2:l2:v0")
    .images()
    .intersects(tile)
    .filter("2022-04-01" <= p.acquired < "2022-05-01")
    .filter(p.cloud_fraction < 0.001)
    .sort("acquired")
    .limit(1)
)
images = search.collect()
Pick just one image to raster and display.
image = images[0]

# Load the data as an ndarray
arr = image.ndarray("red green blue", geocontext=images.geocontext)

# Display the image
display(arr, size=5, title=image.id)
Total running time of the script: ( 0 minutes 2.295 seconds)