Introductory Example
Now that you’ve installed the Python client and tested the connection, you can start using the Platform. This example shows the core interaction with the Platform: searching for imagery and loading it.
$ pip install "earthdaily-earthone[visualization]"
$ earthone auth login
import earthdaily.earthone as eo
import numpy as np
>>> sangre_de_cristo_geojson = {
...     "type": "Polygon",
...     "coordinates": [[
...         [-106, 35.5], [-105, 35.5], [-105, 36.5], [-106, 36.5], [-106, 35.5]
...     ]]
... }
>>>
>>> product = eo.catalog.Product.get("esa:sentinel-2:l2a:v1")
>>> images = (
...     product.images()
...     .intersects(sangre_de_cristo_geojson)
...     .filter("2016-12-01" <= eo.catalog.properties.acquired < "2020-03-01")
...     .filter(eo.catalog.properties.cloud_fraction < 0.1)
...     .limit(10)
...     .collect()
... )
>>>
>>> winter_images = images.filter(
...     lambda image: image.acquired.month in [12, 1, 2]
... )
>>>
>>> winter_images
ImageCollection of 9 images
  * Dates: Jan 19, 2017 to Feb 21, 2017
  * Products: esa:sentinel-2:l2a:v1: 9
>>> ndarray_stack = winter_images.stack(
...     "red green blue",
...     resolution=150
... )
>>>
>>> ndarray_stack.shape
(9, 3, 744, 606)
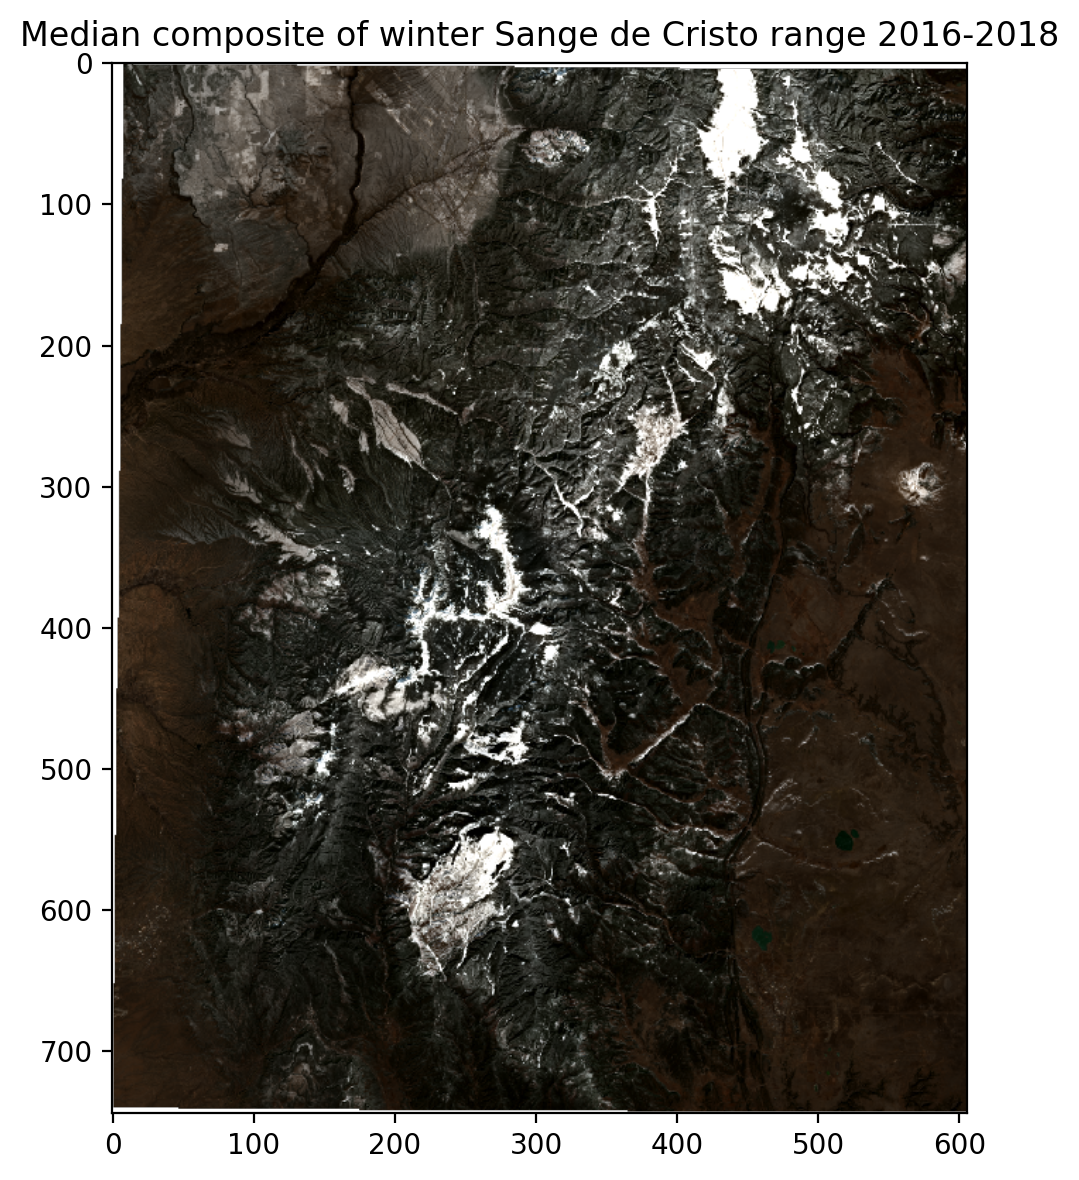
>>> winter_composite = np.ma.median(ndarray_stack, axis=0)
>>>
>>> eo.utils.display(winter_composite, title="Median composite of winter Sange de Cristo range 2016-2018", size=6)