Geospatial 101
Introduction
This reference describes the main geographic concepts that will help you learn the fundamentals of geospatial data and analysis. The Earth is round, and we map it in flat space, so any and all earth observation is based on a combination of cascading representations of reality described here. We also review widely adopted technologies used for global analysis.
Data Models
Raster
The raster data model represents data over a grid of evenly spaced rows and columns of cells, with a data value assigned to each cell. Digital images, including aerial and satellite imagery, are stored using this data model. Read more about EarthOne raster applications in our Remote Sensing 101 Reference.
Continuous Data vs. Discrete Data

The Shuttle Radar Topology Mission (SRTM) product (top) contains slope data expressed in degrees, and is an example of continuous data.
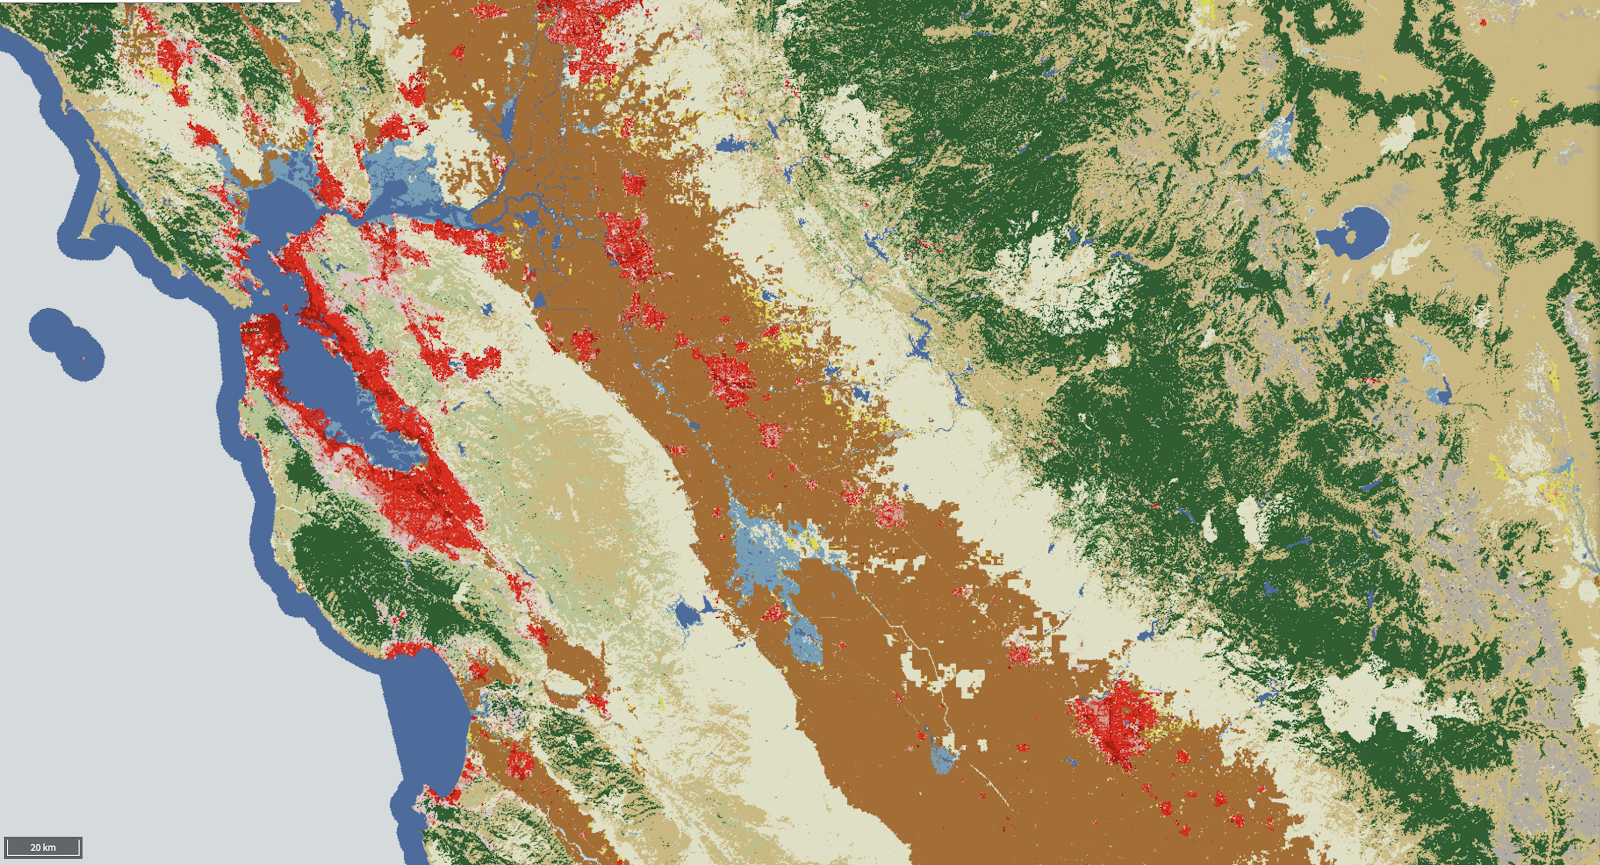
The National Landcover Classification Database (NLCD) displays categorical information, such as “urban” or “agriculture”, and is an example of discrete data.
Rasters are well-suited to represent both continuous and discrete phenomena.
Discrete - Discrete features can be represented in raster space where each cell is assigned a value corresponding to a category, such as land cover (forest, water bodies, etc.) or categories of wildfire risk (high, medium, low). Discrete data is also referred to as thematic or categorical data.
Continuous - Variables that are continuous across space, such as elevation, atmospheric carbon dioxide, or surface temperature, are typically represented in raster space where each cell represents the measured or modeled value of the variable over that location.
The most common type of continuous data you’ll encounter on our platform is an image. Image data is often based on reflected electromagnetic radiation that can be manipulated to create photograph-like representations. Red, green, and blue are the visual segments of the electromagnetic (EM) spectrum used to create a true-color image that most closely matches what we would expect to see looking from a satellite or airplane. We can create false-color images by visualizing portions of the EM spectrum outside of the visual range, which can provide new information. For example, near-infrared reflectance is often used to better visualize vegetative health.
Note
EarthOne stores individual images as scenes or images. You can search for images and load data using the Catalog API.
Common file formats: GeoTIFF, JPG/JPEG, netCDF
Vector
The vector data model is used to represent discrete features using points, lines, and polygons. Data is stored using x, y coordinates that define the vertices of the features, such as locations of dams (points), roads (line), or political borders (polygon).
Common file formats: Shapefile, GeoJSON, KML
Coordinate Systems
A coordinate system is a method to define the unique position on a plane or in space of geometric elements using combinations of numbers called coordinates. There are two types of Earth coordinate systems: geographic and projected.
Geographic coordinate systems Geographic coordinates are perhaps the most familiar way of representing coordinates on the Earth’s surface. In these coordinates systems, a location is represented by its latitude (north-south position) and longitude (east-west position). Latitude and longitude are defined using an ellipsoidal representation of the Earth. Because the coordinates are defined on a curved surface, the physical distance covered by one degree of longitude will vary from north to south (due to convergence at the poles), as will latitude from east to west (due to the ellipsoid shape). Placing coordinates on a flat surface requires a map projection, described in the next section.
Map projections and projected coordinate systems For many practical purposes, we need to project coordinates onto a 2D plane. A projected coordinate system is defined on a flat, two-dimensional surface. Projected coordinate systems describe locations in linear units (such as meters or feet).
Since map projection are abstractions of a 3D Earth onto a 2D plane, distortions are inevitable. These distortions differ for each map projection but are well known and studied. Distortions that can occur with a flat map include those related to: - shape - area - distance - direction
While it is impossible to maintain all the native spatial elements of your geometries once projected, you can prioritize the most important element for your maps purpose. Projections often use descriptive names like “conformal”, “equidistant”, “equal-area”, and “azimuthal” to describe the properties that they preserve. A projection can accurately preserve one property (either shape, area, distance or direction) but not others. For this reason, it’s important to choose a projection that preserves the properties that are relevant to your application. For example, the Mercator projection is used for navigation because it preserves the angle between any two curves (conformal projection).
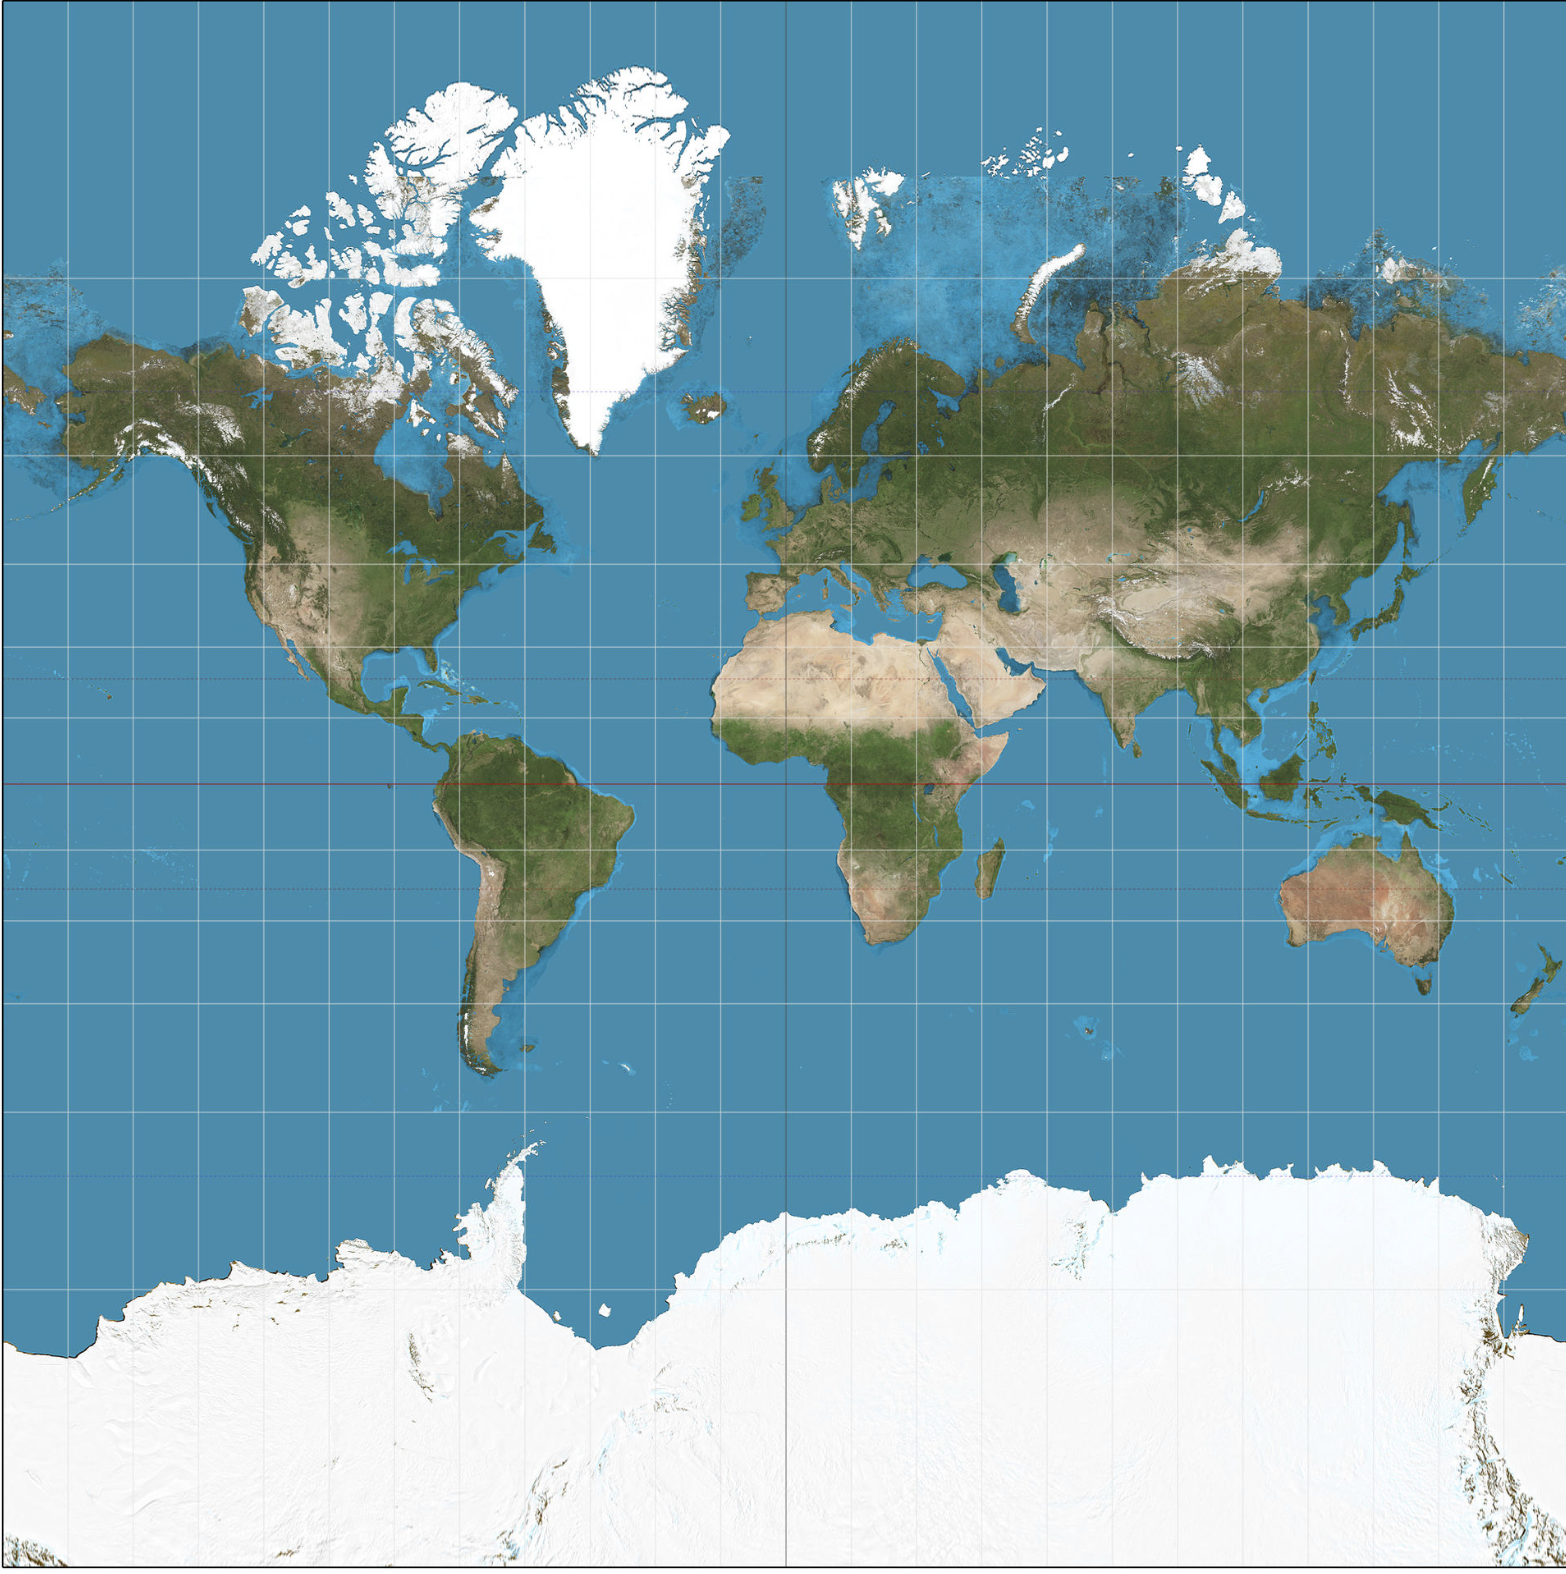
Mercator Distortion: The Mercator projection is area distorting, resulting in land masses near the poles to appear much larger relative to those at the equator.