Explorer
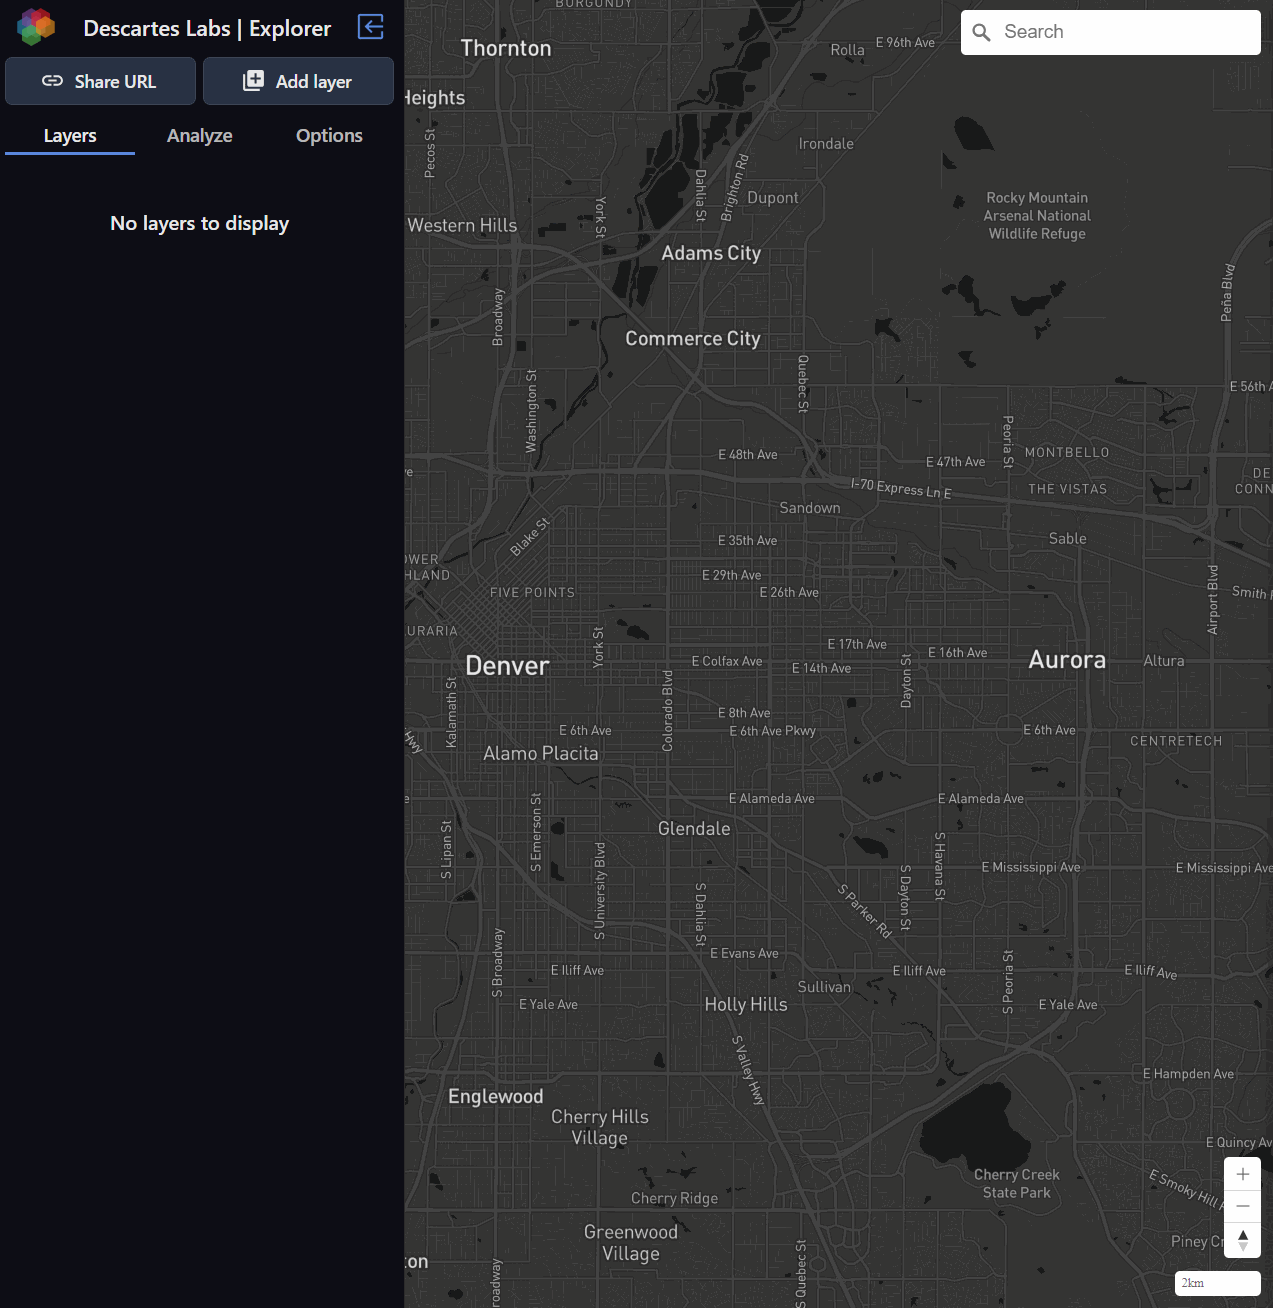
Our Explorer interface allows users to search and visualize data products available on the Platform. Utilizing Explorer is a great way to become familiar with data products and their metadata. It also allows users to manage their own datasets. All raster products uniquely available or owned by a user are shown in Explorer.
View Product Details
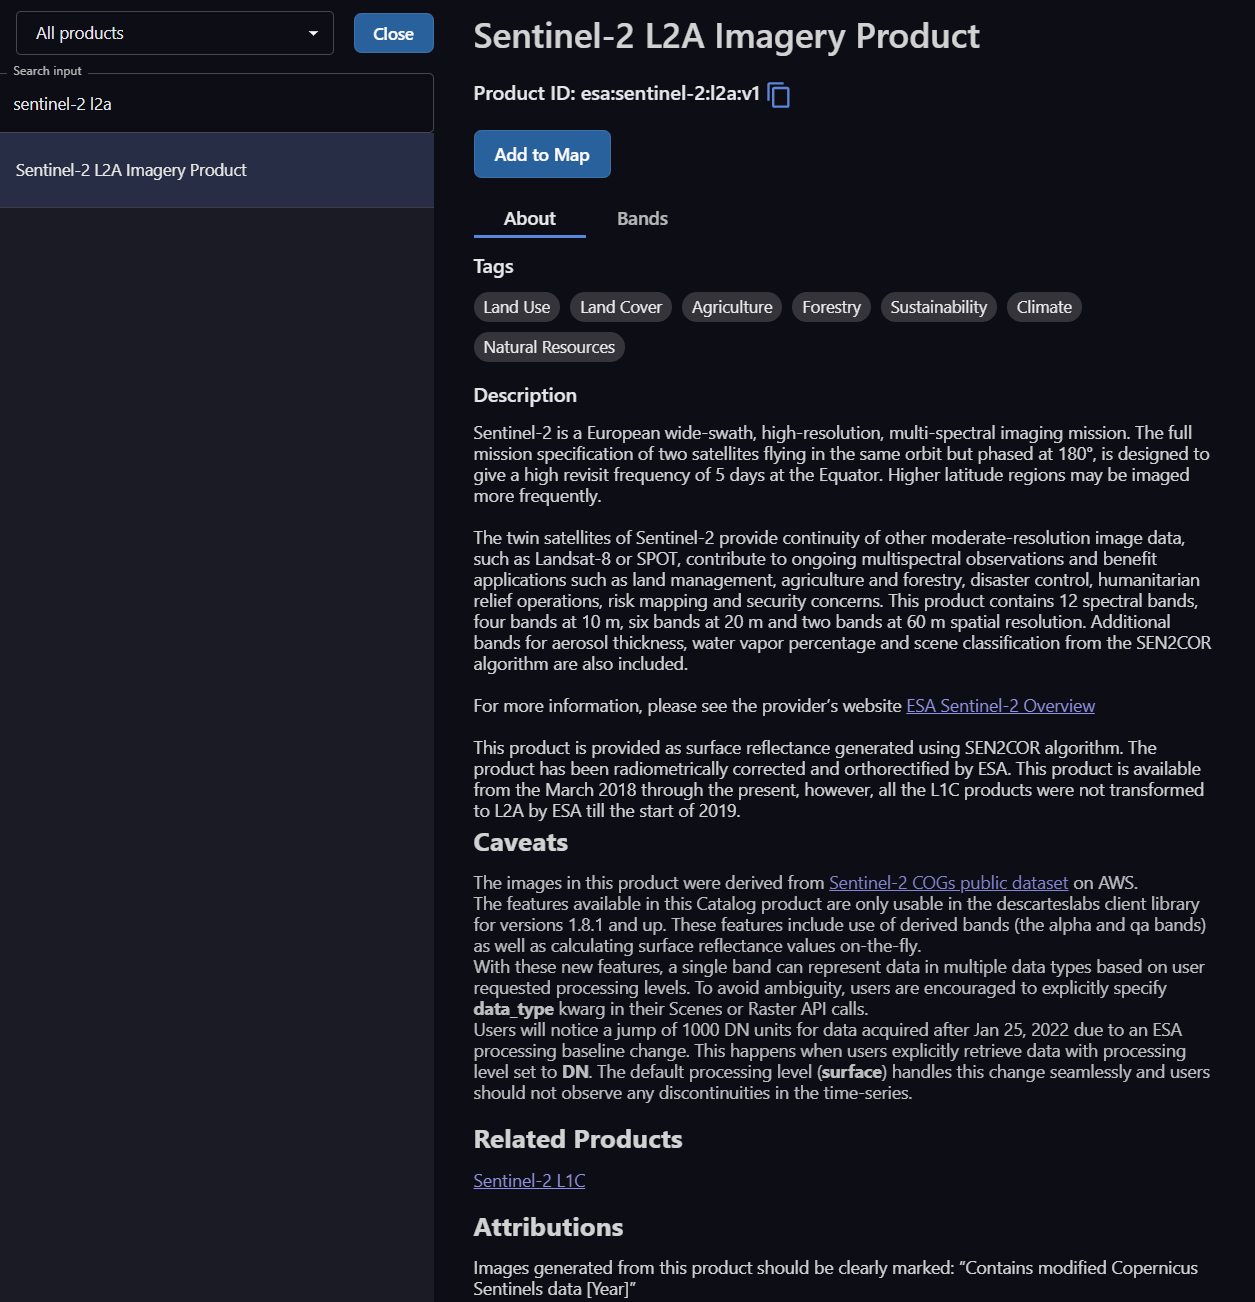
Clicking on “Add layer” will open up the Datasets view. Here the user can see all available data Products, you have the option to toggle between “Core products” as well as “My products”. Clicking on a layer’s entry will open a dedicated page that shows all the associated metadata of the product. Here is the page for Sentinel-2 L2A, for example. One of the first things to point out is the Product ID. This ID is used to search for imagery programatically in the Python client.
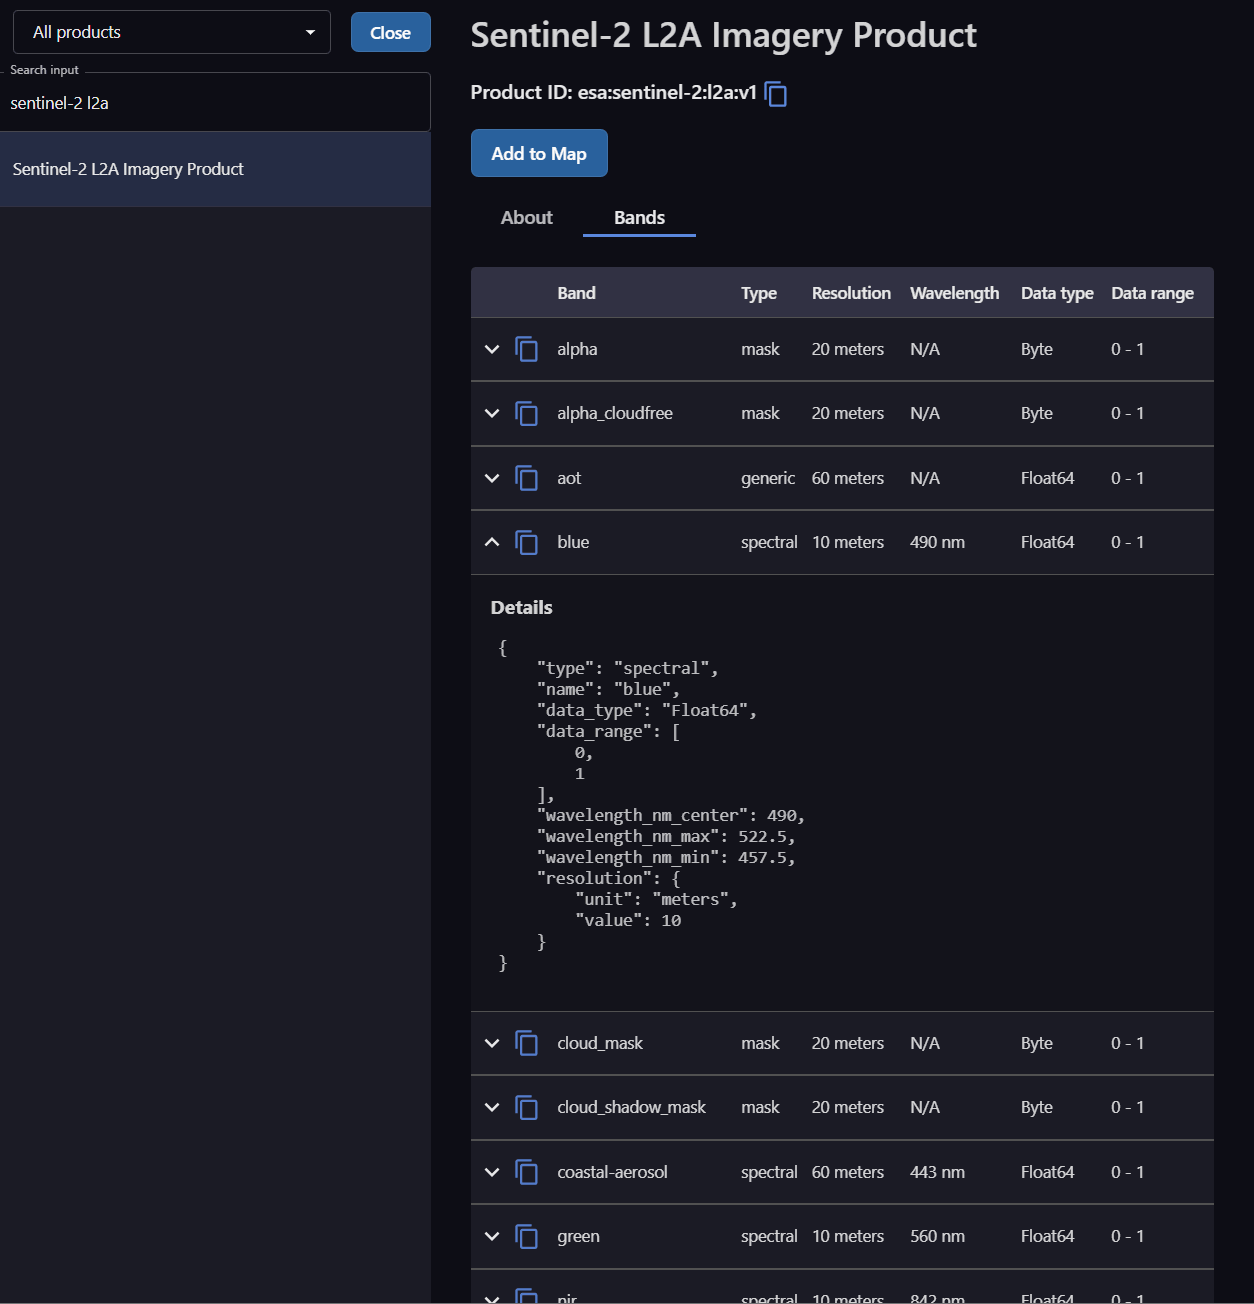
The product’s band information is also displayed here, including if they are native to the platform or sensor. All associated metadata about the bands are listed as well, in terms of band type, data type and a short description of the band. Clicking a band provides more information specific to that band. It has important information such as spatial resolution (resolution, resolution_unit), processing level (processing_level), and the range of the data (data_range).
Product Extent
For each product, the number of scenes available is coveniently plotted by date toward the bottom of the product details panel.
Adding Data to the Map
Clicking “Add to Map” from a layer’s dataset view will add that specified layer to the Explorer map viewport.
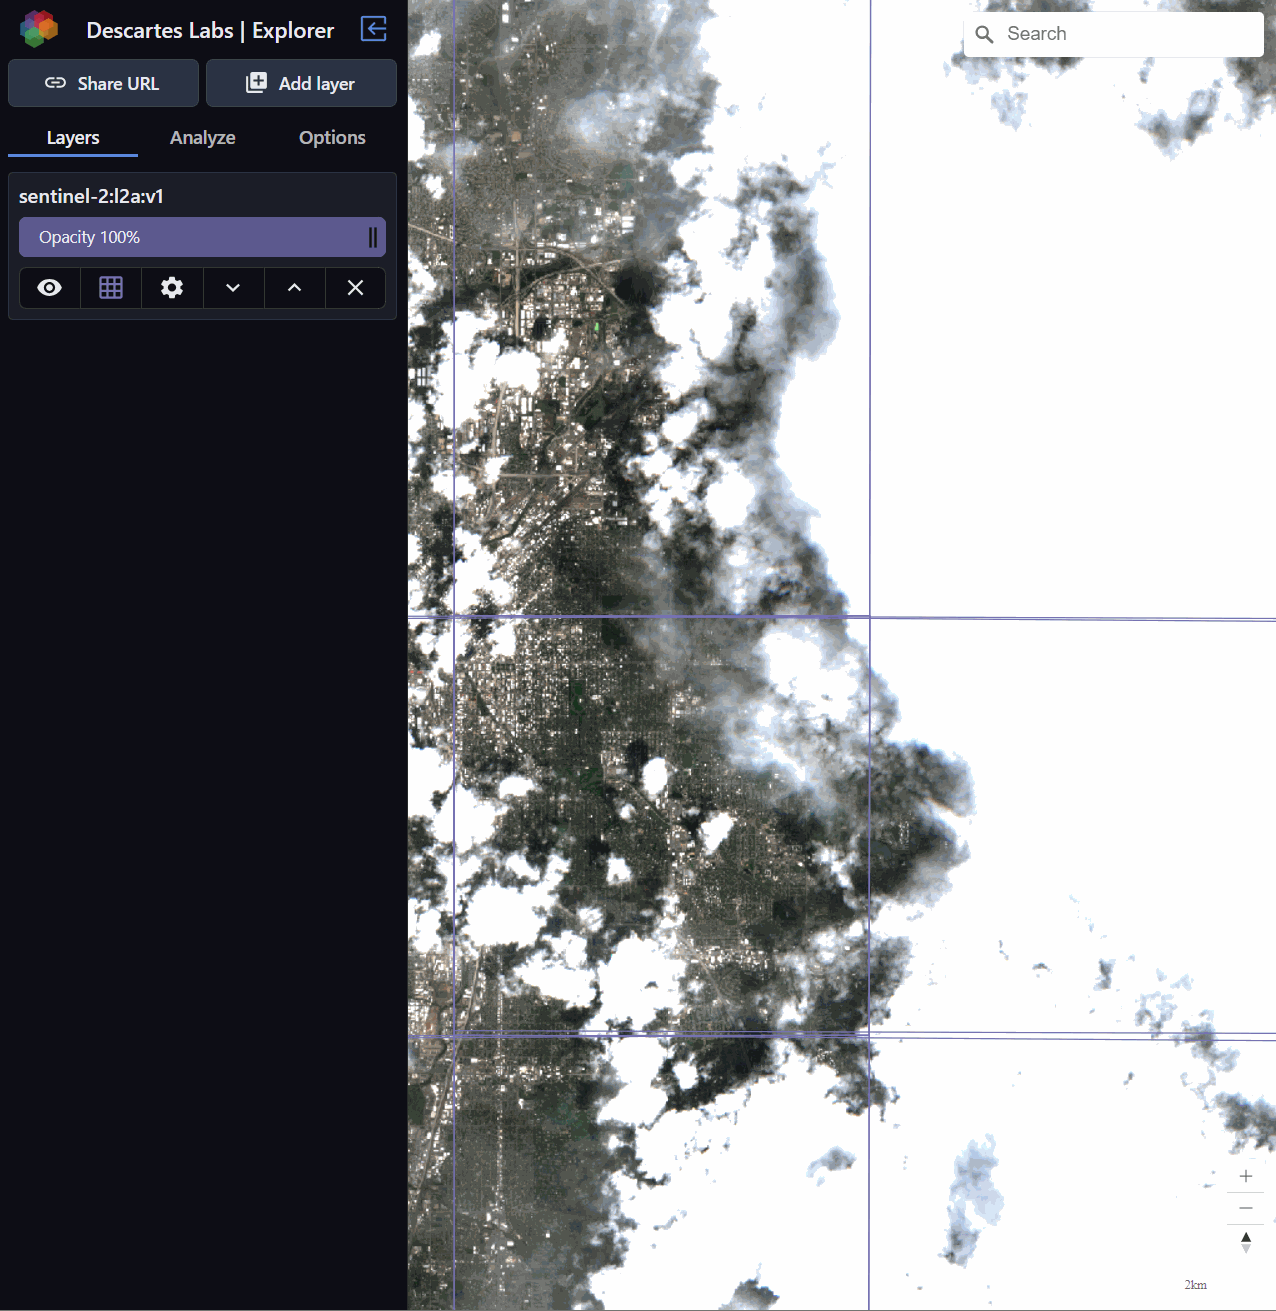
Layer Opacity
Use the opacity slider beside the desired layer’s name to adjust its opacity.
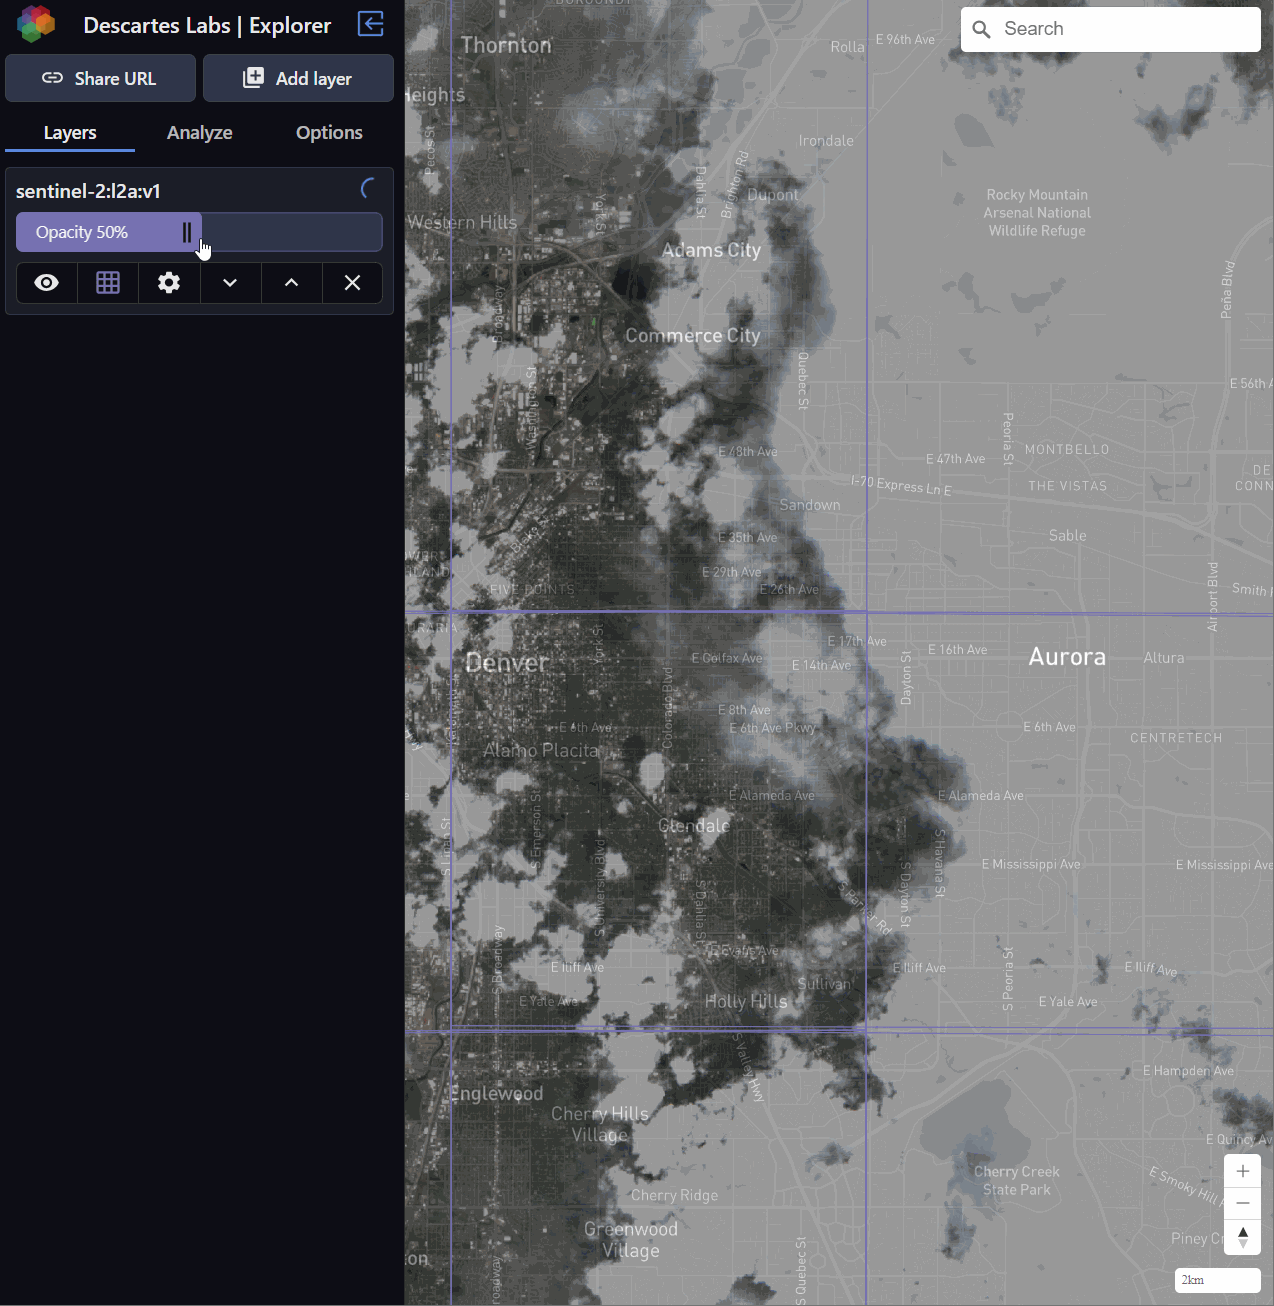
Image Outlines
To toggle on and off Image outlines, click the “Metadata grid visibility” button.
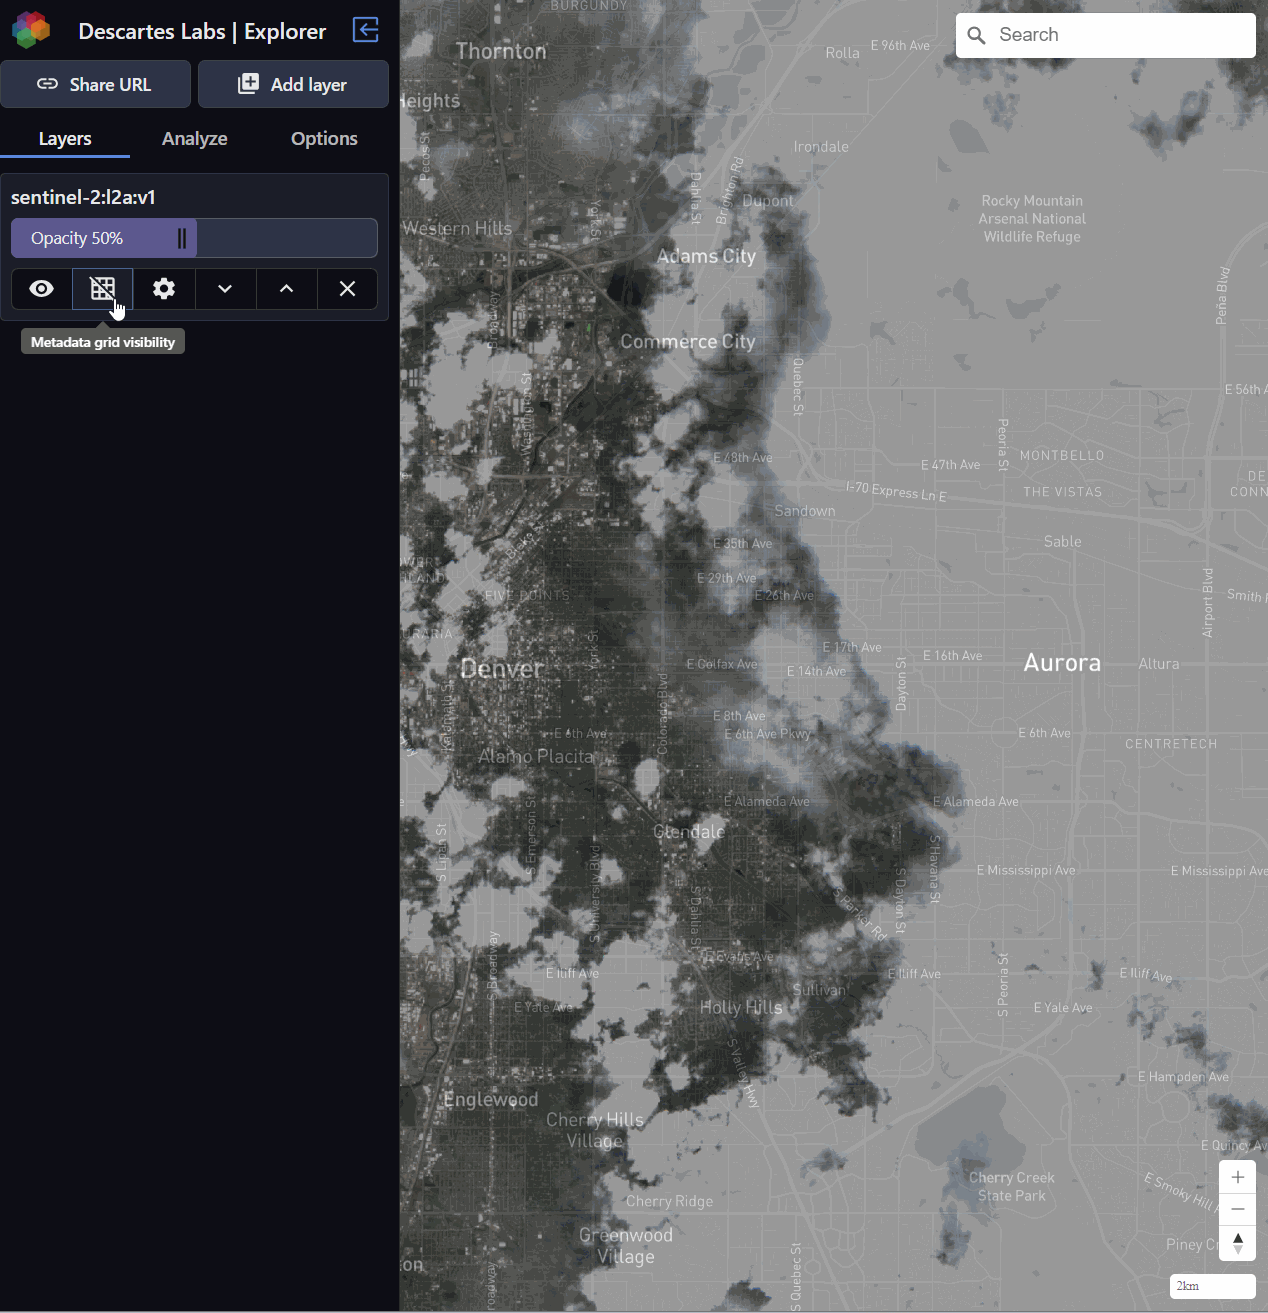
Image Feature Metadata
To view a particular Image’s metadata attributes, such as Image ID, acquired date, and cloud fraction, click on the grid cell with Metadata grid visibility toggled on.
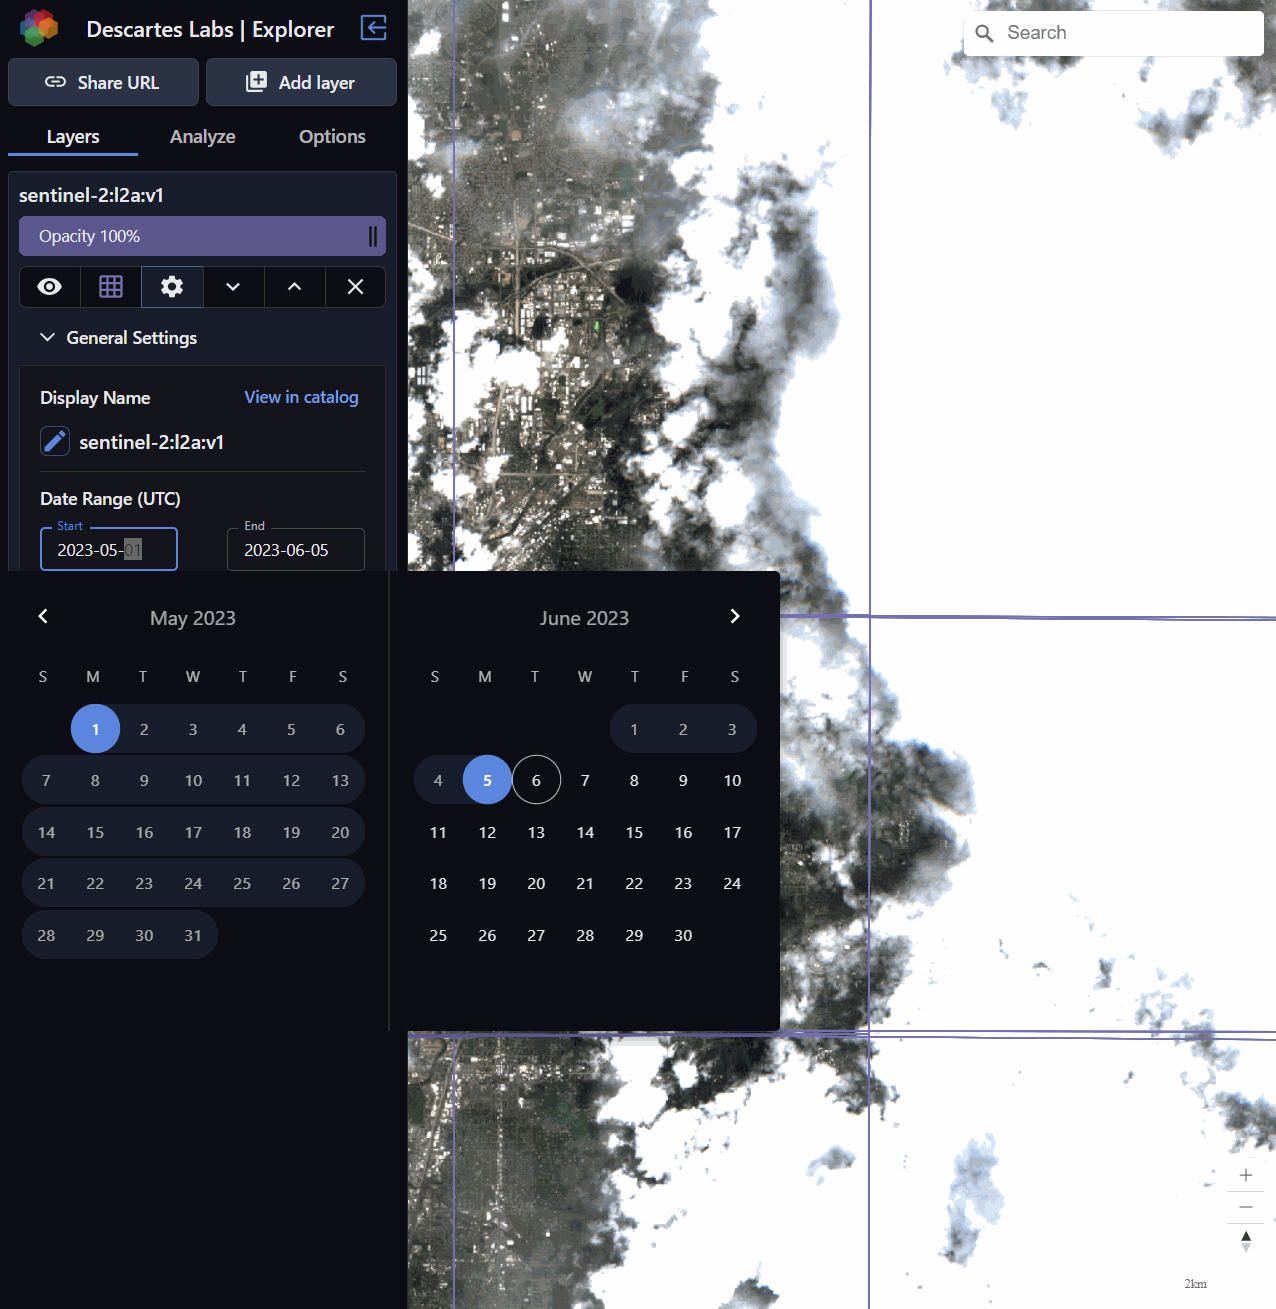
Date Range Selector
Sentinel-2 L2A has an incredible temporal resolution. To browse datasets temporally, use the Date Range selector. Expand “General Settings” to change the mosaicked date range in the viewport.
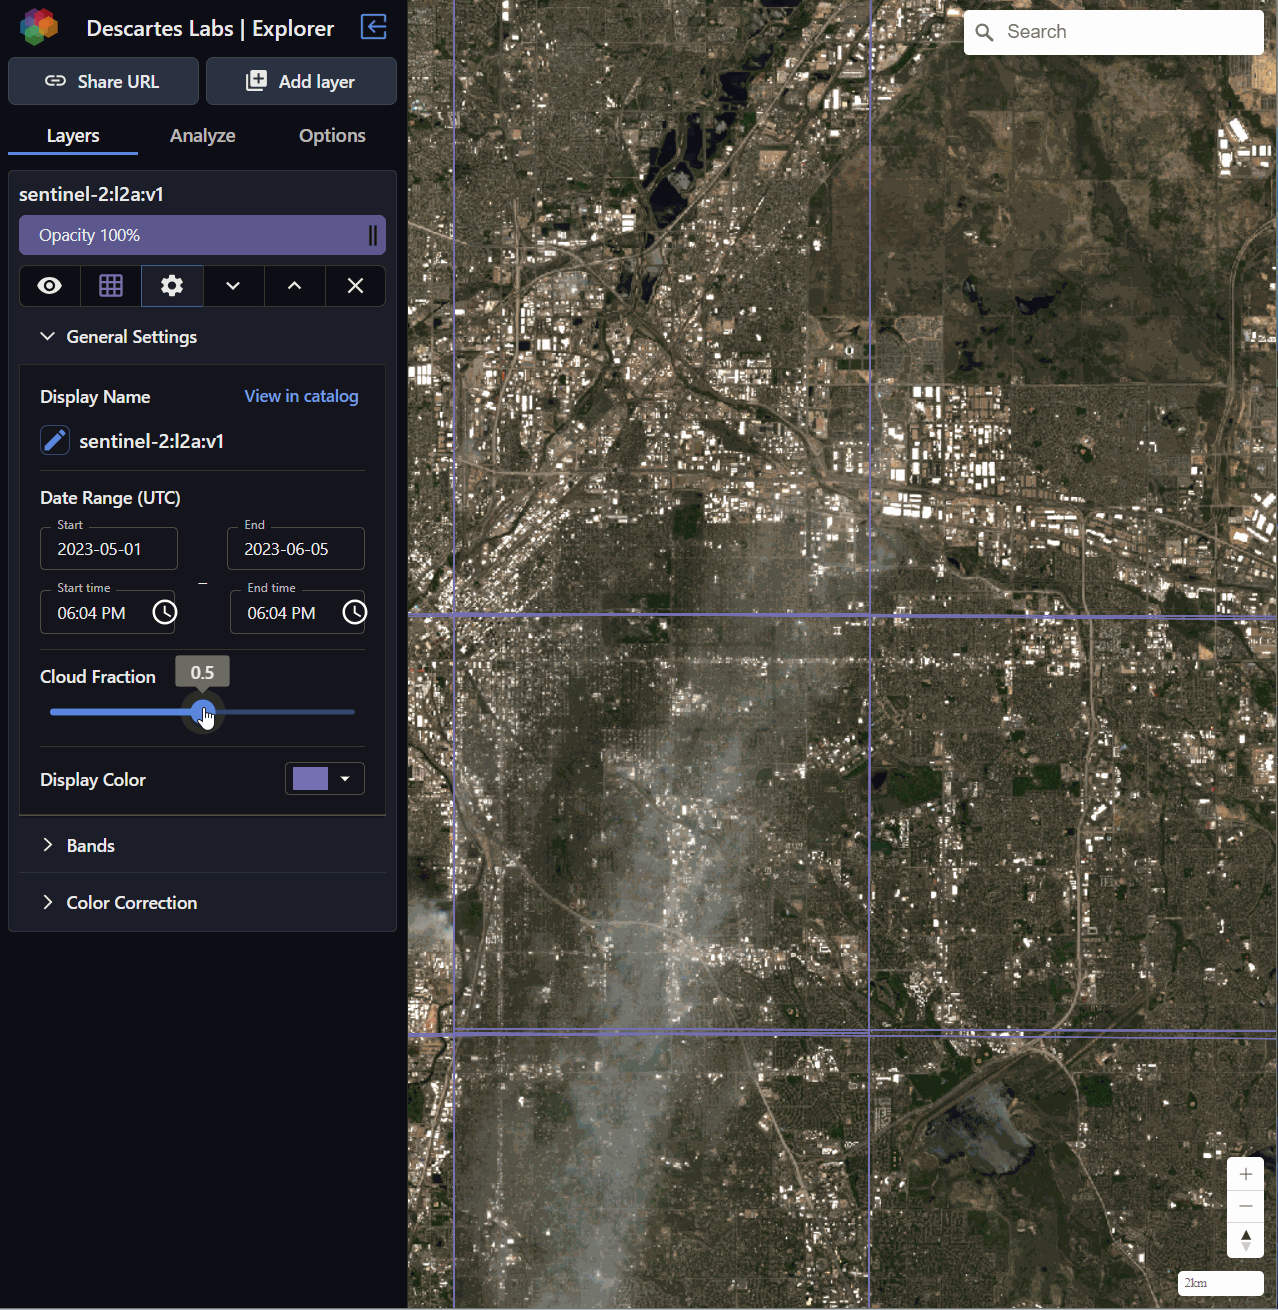
Cloud Fraction Slider
Some Products, such as Sentinel-2 L2A, store cloud_fraction as an Image metadata attribute. Under “General Settings” the user can omit Images from the visualized mosaic that have a specified cloud fraction.
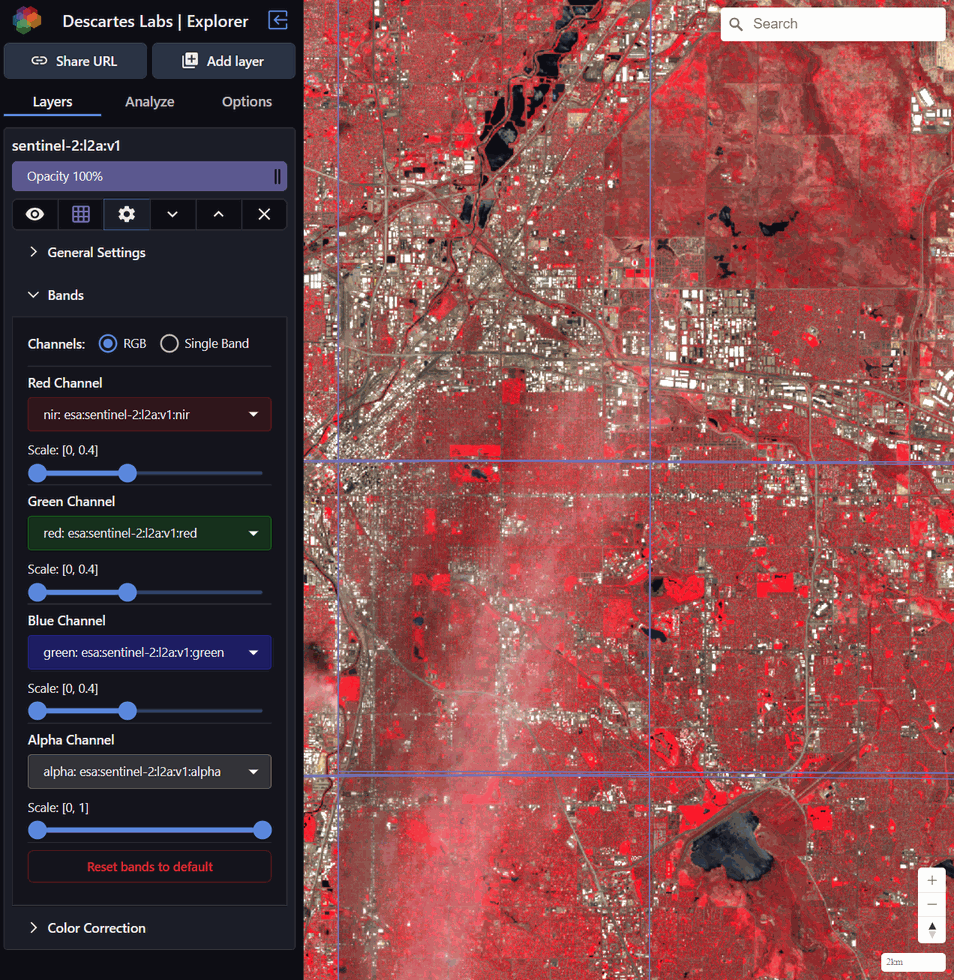
Explore Band combinations
In the “Settings” view click the dropdown labeled “Bands”. Here the user can specify RGB or Single Band to visualize different combinations, such as a False Color Composite (NIR to Red, Red to Green, and Green to Blue)
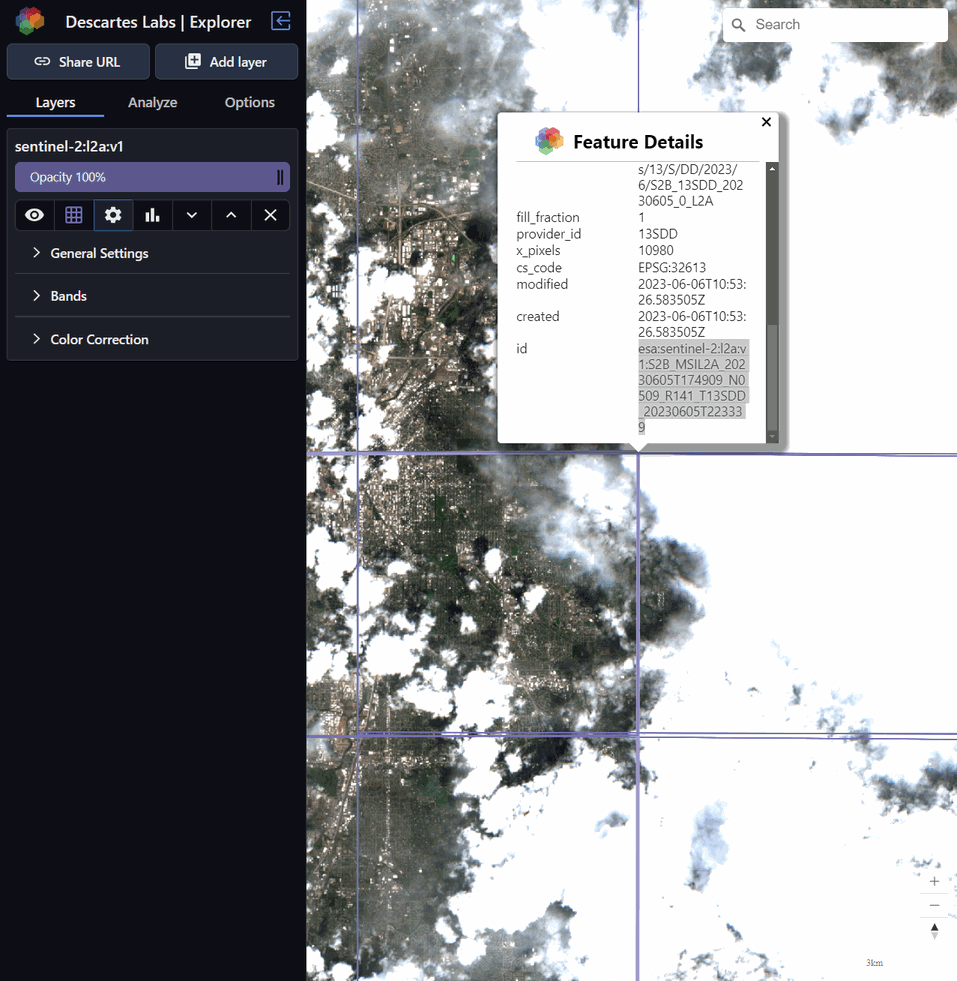
Feature Metadata
To find the complete metadata associated with a feature, select the comment box icon in the top right hand corner of the layer window and click on an image to view its metadata.
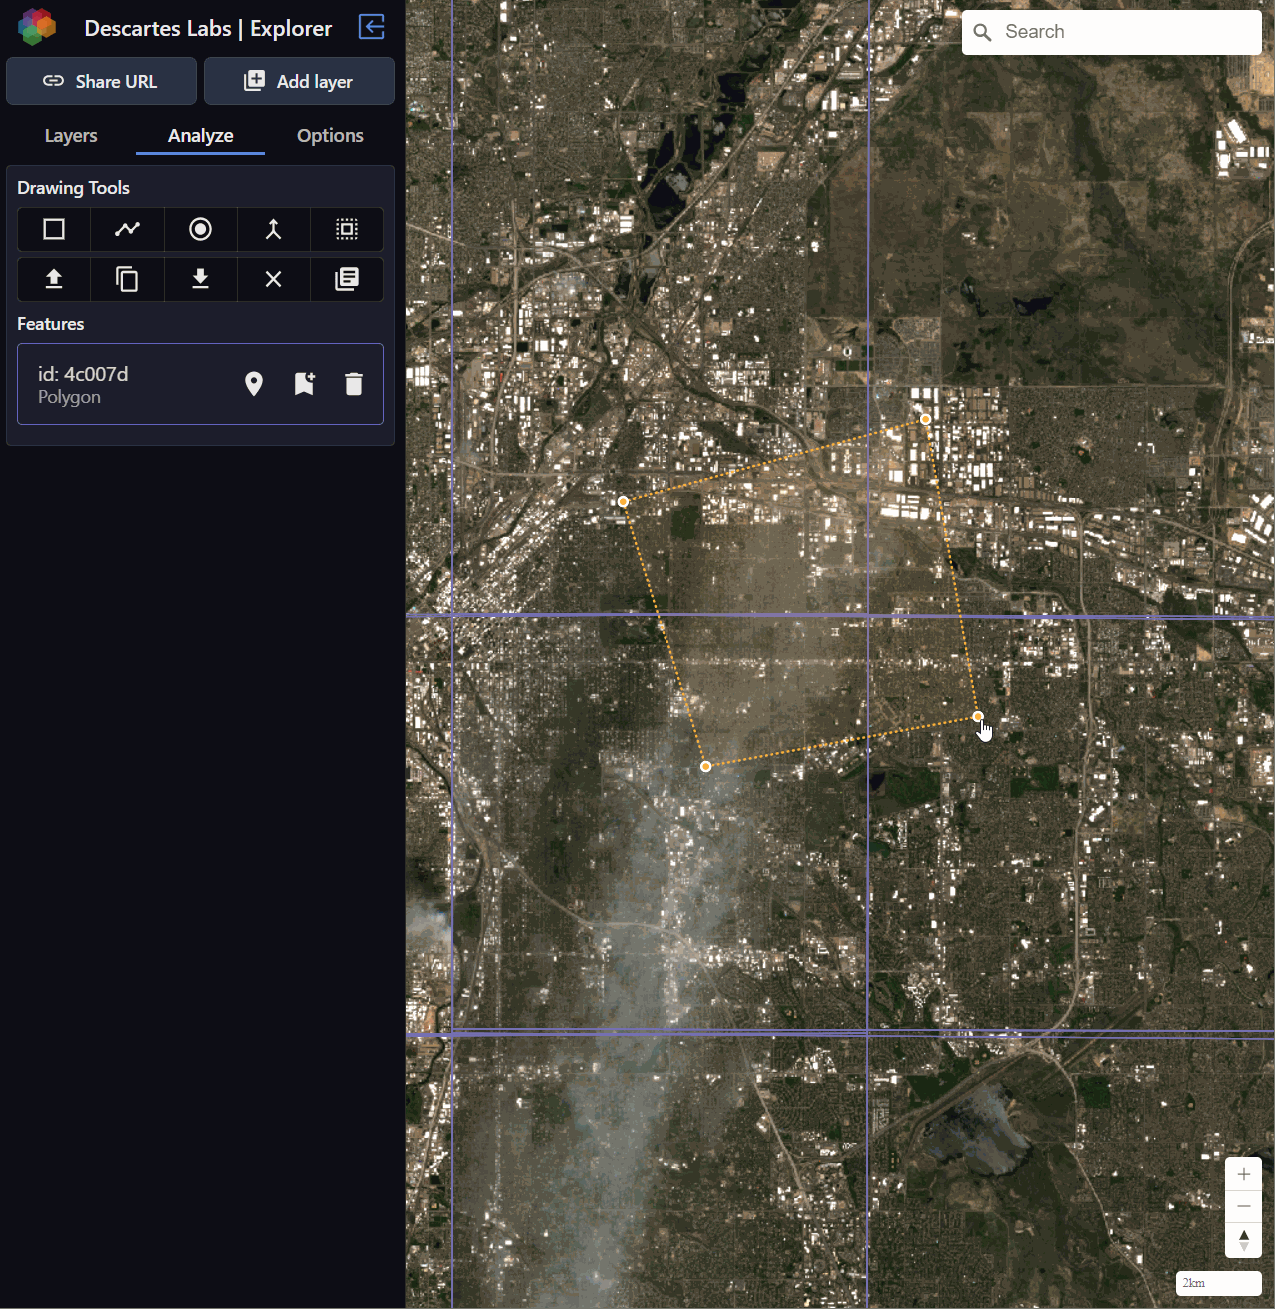
Drawing vectors
Users can add, load, and download point, line, and polygon vector features to your Explorer window. To access these tools, click the “Analyze” tab to draw and upload simple GeoJSON Feature Collections.